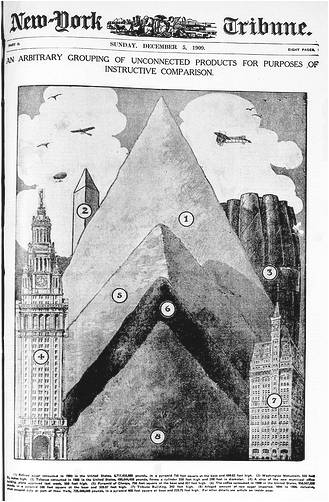
i ♥ infographics

I've always loved infographics. But are we missing a trick in not using them more often?

by Darren Caveney

The first recorded infographics were early cave drawings.

And infographics have been a constant, creative and brilliantly simple medium guiding, helping and directing us ever since.

They take so many forms, from weather maps to motorway signs.

If you have been abroad this summer then you probably got around just that little bit easier because of infographics. They are universal, they are 'easy-read', they cross boundaries and language.

What's not to like.

So why don't we use them more often in our communications roles?

Yes, I know we all use use them on some level, even if it's something as simple as a graph to show an increase or a decrease in something we're measuring.

Read more
Print Friendly and PDF

measure twice, cut once

by Darren Caveney

I’ve always had a fascination for stats, and a sadly photographic memory for stat-related trivia.   This problem surfaced as a youngster.  As a 10-year old I could reel off the brake horse power and top speed of pretty well any car in my Top Trumps sports cars pack.

I even began to memorise chunks of the more interesting sections of my 1977 edition of the Guinness Book of World Records.

When it came to football I could bore with the best of them on stats and figures. It partly came from spending too much time staring at Ceefax on a Saturday evening following the day’s results (pages 312 through to 324, for those in the know).

And I could probably tell you the attendance, to within a couple of a hundred, at most of Birmingham City’s key home games in the past 20-odd years.  


So, no surprise then, that one of my favourite quotes ever comes from Vic Reeves who once said that “88.2% of statistics are made up on the spot.”

Read more
Print Friendly and PDF